.avif)
Know Where Your Pipeline Stands, Without a Spreadsheet in Between
Shipthis Sales CRM brings pipeline health, forecast progress and target performance into one live dashboard, with each person seeing the numbers relevant to their role without needing to build a spreadsheet. Managers get a view of their team. Salespeople see their own performance. Leaders see the organisation. And when you need to go deeper, Reports lets you filter and drill into the numbers and the underlying data.
The dashboard already knows where the month stands.
.png)


.avif)
Shipthis tracks actual revenue against target pace, so you can see early whether you're ahead, on track or falling behind.
.png)
Revenue to date only tells you what has already happened. Shipthis adds the missing context, the pace you need to maintain, the pace you're actually running, and what you'll need from the days ahead to reach target. That gives sales leaders an early signal when performance starts drifting, while there's still time to act, adjust the pipeline and close the gap.


Three Views. One Dashboard. The Right Numbers for Every Role.
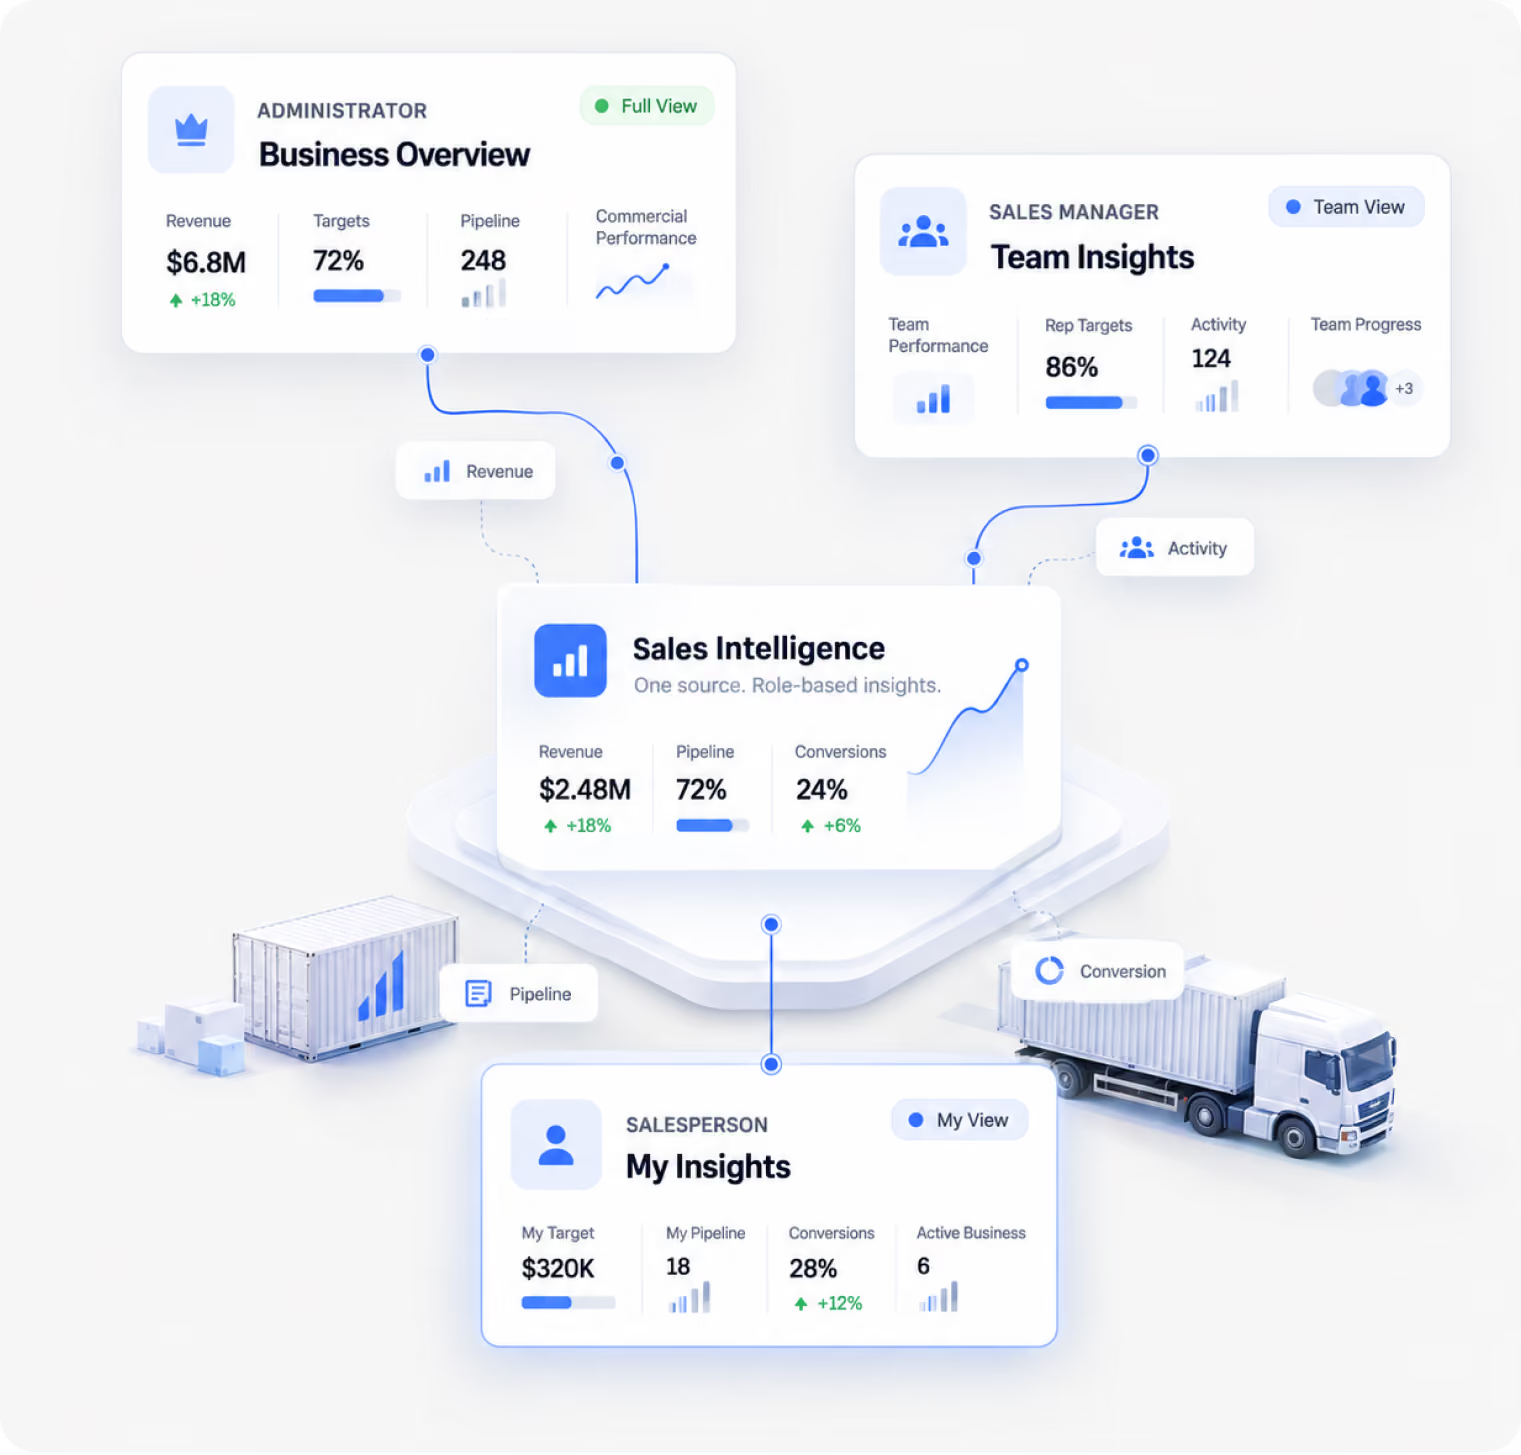
Administrators see the business. Managers see the team. Salespeople see their own performance, with dashboard access automatically scoped to their role.
One dashboard, automatically tailored to the role using it. Administrators and senior commercial users get the full business view across revenue, targets, pipeline and commercial performance. Sales managers get Team Insights to track rep performance, targets, activity and team progress. Salespeople get My Insights to focus on their own targets, pipeline, conversions and active business.
.png)
Actual, Current, and Required Run Rate, Read Together, They Tell You If You're Slipping
Three per-day pace cards, each calculated against the current calendar month, the pace the target implies, the pace you're actually running at, and the pace still needed to close on target.
Three numbers answer one critical question: are you on pace to hit this month's target? Actual Run Rate shows the daily pace your target demands. Current Run Rate shows the pace you're actually delivering based on revenue achieved so far. Required Run Rate shows the daily pace you need from here to finish the month on target. All three are calculated against the current calendar month, so you can read them together at a glance. When your current pace falls below the pace still required, you know the month is starting to slip, while there's still time to act.
A Large Pipeline With No Recent Activity Is a Warning Sign, Not a Reassurance
See what's in the pipeline, what's converting, what's driving revenue, and whether your team is actively moving it forward.
Shipthis brings pipeline, customers, products, commercial follow-up and activity into one view, so you can see both the size of the opportunity and the work happening behind it. See pipeline by stage and salesperson, track how sales are trending month by month, and identify the products and customers driving performance. Then go one level deeper with high-value leads, active quotations, converted customers and pending invoices. Activity adds the missing context, status changes, lead notes and team activity, so managers can see whether opportunities are being actively worked or simply sitting in the pipeline.
.png)
.png)
The Dashboard Is for the Review. Reports Are for the Deep Dive.
When you need to go deeper, Reports gives you the filters, detail and exports to find the number behind the number.
Go from the headline number to the detail behind it. Search, filter, sort and customise columns across sales, revenue, leads, quotations, shipments, invoices, targets and activity. Break revenue down by salesperson or customer, track lead conversion and pipeline movement, follow quotation activity, or drill into individual performance and team targets. Export any report to CSV, XLSX or PDF for deeper analysis, sharing or follow-up.



Know Where the Sales Numbers Stand. Know What Needs to Happen Next.
One live view of pipeline, performance, targets and activity, with the detail to move from insight to action.
.png)
Shipthis brings the numbers your sales team needs into one connected view. See how the business is performing, whether you're on pace to hit target, where the pipeline is moving, what needs attention and how each salesperson is tracking against their goals. Every view is connected to the underlying CRM data, scoped to the role using it, and backed by detailed reports when you need to go deeper, so the dashboard isn't just a place to check numbers, it's where sales leaders see what's happening, spot what needs attention and decide what to do next.
Your Sales Dashboard, Set Up Around How Your Team Actually Works
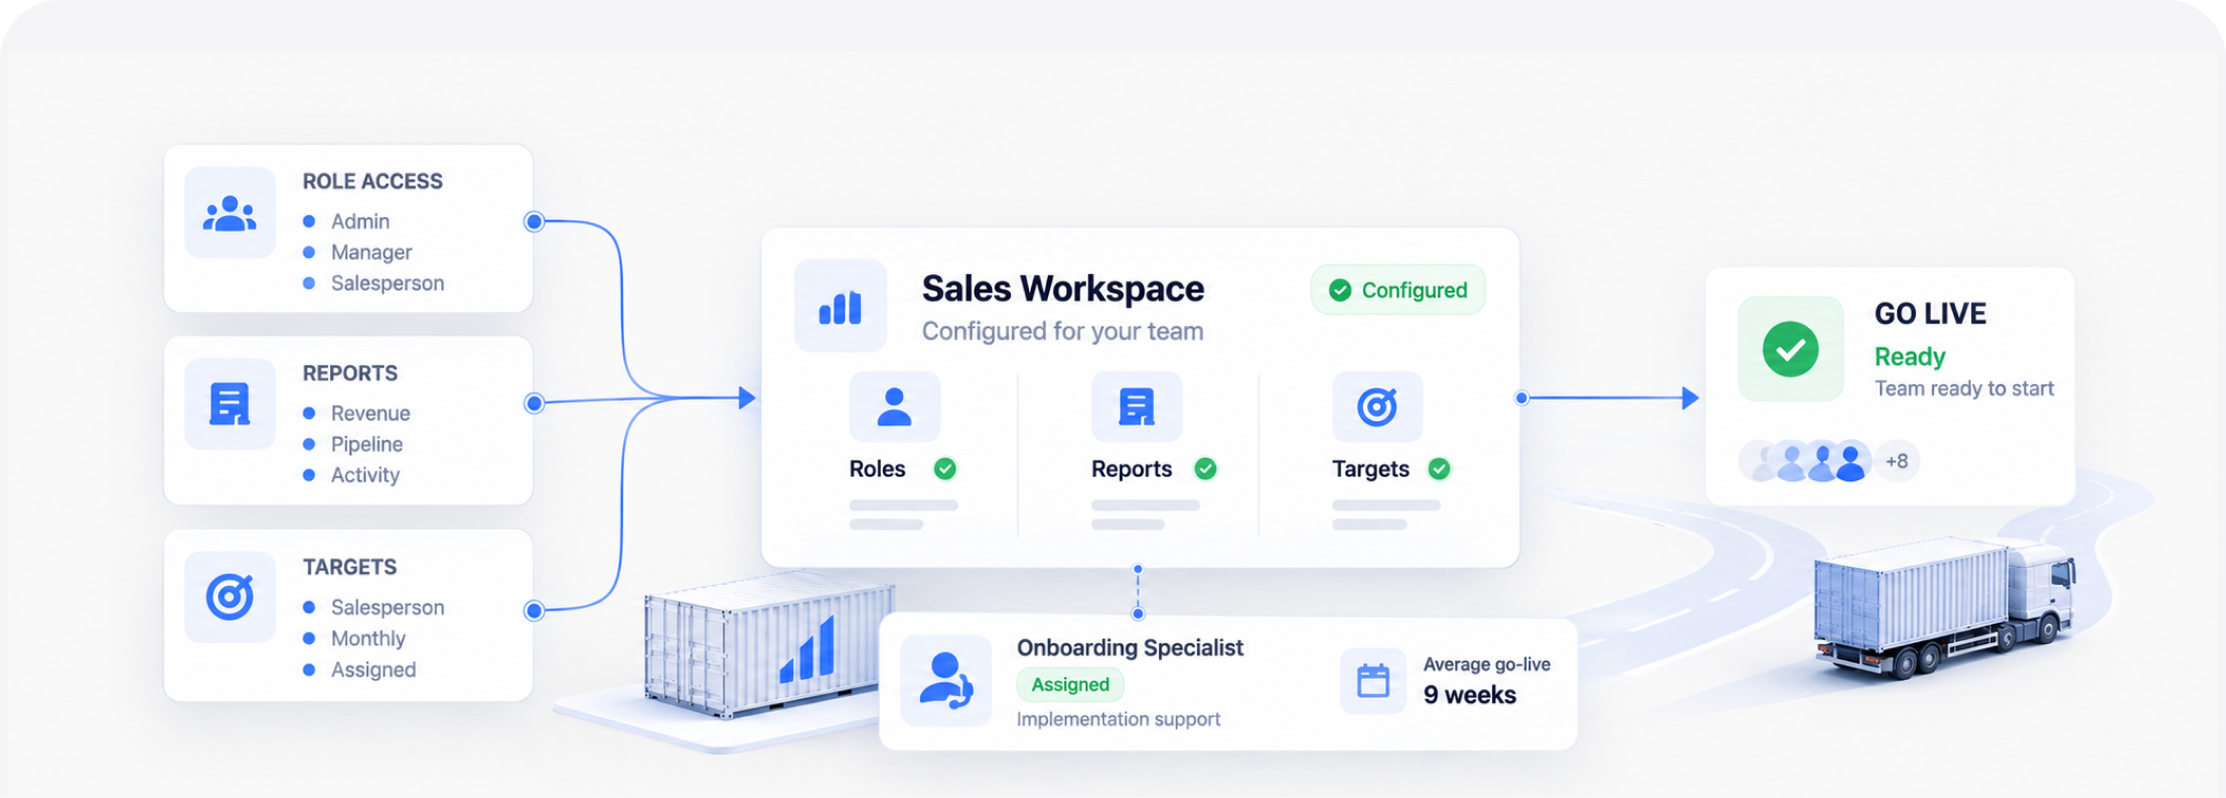
The dashboard is configured around your sales organisation before the first user logs in. Shipthis sets role-based access, reporting views, the Reports catalogue and salesperson targets as part of implementation, so every user starts with the right information, the right level of visibility and the right targets already in place. Most customers are fully operational within 9 weeks.
Bring Your Actual Pipeline Review. We'll Show You It Already Built.
The fastest way to evaluate this is against the numbers your last review meeting actually needed.
Book a demo scoped to how your team runs pipeline and target reviews today, or start a free 30-day trial to see the dashboard populate from your own data.

Sales Intelligence & Insights Questions, Answered
That target type wasn't enabled on their Salesperson Target record. An empty widget means the target was never set up to measure, not that performance was zero.
Actual Run Rate is the pace the assigned target implies per day. Current Run Rate is the pace you're actually achieving. Required Run Rate is the pace still needed to hit target. Read together, they show whether the month is on pace, not just how much revenue has come in so far.
They're likely using a different Report By basis, invoiced revenue, booked revenue, and quotation pipeline are genuinely different figures. Fix the date range and Report By basis before a review so everyone's looking at the same number.
No. The default tab is for administrators and senior commercial users, Team Insights is for managers, and My Insights is for individual salespeople, which tabs appear depends on role.
Yes, through the separate Reports area, with search, filters, sorting, and export to CSV, XLSX, or PDF.
It's configured per organisation, so your list can be shorter or longer than a generic default, based on what your team actually uses.